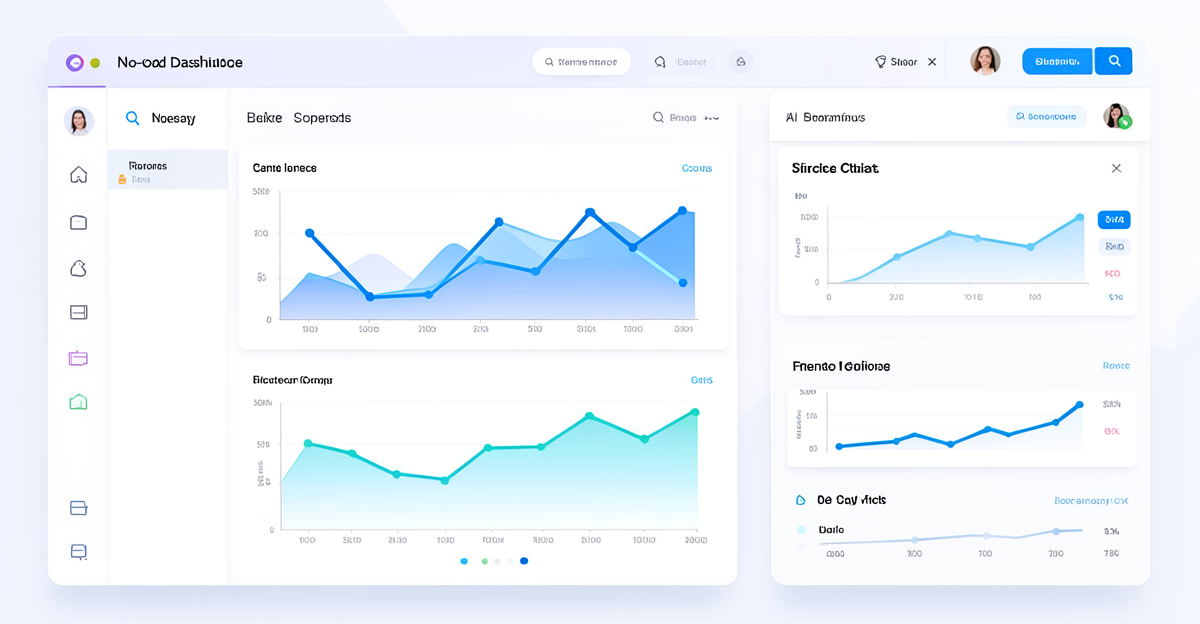
You no longer need to master SQL, Python, or Excel formulas to get meaningful insights from your data. Modern AI data analysis tools let anyone upload a spreadsheet, ask a question in plain English, and receive clear answers with charts and recommendations. This guide walks you through the best platforms, what they cost, and how to use them in your own workflow.
Every business collects data now, but most people still struggle to turn that data into useful insights. Spreadsheets fill up with formulas, dashboards become cluttered, and the people who actually understand the numbers are the ones everyone keeps asking for help. The good news is that AI data analysis has reached a point where anyone can get reliable answers without writing code.
What AI Data Analysis Actually Means
AI data analysis refers to platforms that let you upload raw data and ask questions in natural language. Instead of building complex queries or writing scripts, you type something like "show me which products had the biggest sales drop in Q3" and the tool figures out the rest. These platforms handle the calculations, create charts, and often spot patterns you might have missed.
What makes this different from traditional analytics tools is that you do not need to know which statistical methods to use, how to clean your data, or which chart type works best. The AI handles those decisions for you. You just need to know what you want to find out.
Top AI Data Analysis Tools for Non-Technical Users
Several platforms stand out for people who want powerful analysis without learning new skills. Here are the tools worth considering:
- Microsoft Power BI with Copilot — Integrates with your existing Microsoft 365 workspace. Great for teams already using Office. Pricing starts around $10 per user per month with Copilot add-ons.
- Tableau with Einstein — Industry-leading visual analytics with strong AI assistance. Best for organizations that need publication-quality charts and dashboards. Pricing starts around $70 per user per month.
- ThoughtSpot — Pure search-driven analytics. You literally search your data like Google. Excellent for teams that want quick answers without building dashboards. Pricing starts around $40 per user per month.
- MonkeyLearn — Focuses on text analysis and sentiment detection. Perfect if your main data is customer reviews, survey responses, or support tickets. Free tier available, paid plans start around $299 per month.
- Google Looker Studio — Free and tightly integrated with Google products. Best for organizations already invested in the Google ecosystem. Limited AI features in the free version, but solid for basic analysis.
- ZipData — Newer platform with strong natural language query support. Upload any file and get instant analysis. Starting around $25 per user per month.
How to Get Started with Your First Analysis
Getting started is simpler than you might think. Here is a practical workflow that works for most tools:
Step 1: Gather Your Data
Start with whatever data you already have. CSV files from your CRM, spreadsheets from Excel, or exported reports from your analytics platform all work. You do not need to clean everything perfectly — modern tools handle messy data well. Export a recent quarter of sales data, customer records, or website traffic reports and save them as CSV files.
Step 2: Choose Your Platform
Match the tool to your needs. If you work mostly with spreadsheets, Power BI is a natural fit. If you need beautiful visual reports to share with executives, Tableau is worth the investment. For quick ad-hoc questions, ThoughtSpot or ZipData let you get answers in seconds. Most platforms offer free trials, so test two or three before committing.
Step 3: Upload and Connect
Most platforms let you upload data directly or connect to your existing databases. Start with a single file to understand how the platform works. Try uploading a CSV and asking a question in plain English. You will see the tool interpret your question and return results within seconds.
Step 4: Ask Questions Naturally
This is where the real value shows up. Instead of building filters and pivots manually, type questions like:
- "What were our top five products last month?"
- "Show me the trend in customer satisfaction scores over the past year"
- "Which region had the highest growth rate?"
- "Compare Q3 performance to Q3 last year"
The AI translates your questions into queries, calculates results, and presents them with relevant charts and summaries.
Common Use Cases and Real Examples
AI data analysis tools are useful across many roles and industries:
- Marketing teams can analyze campaign performance, customer segmentation, and channel attribution without waiting on data analysts. A marketing manager at a mid-size company reported using AI analysis to cut their campaign review time from two days to two hours.
- Small business owners can monitor revenue trends, inventory levels, and customer behavior from a single dashboard. Many Shopify and WooCommerce stores now use AI tools to spot trends in sales data automatically.
- HR professionals can analyze employee retention, satisfaction survey results, and hiring metrics. AI tools can identify patterns in turnover data that point to specific departments or time periods.
- Content creators can analyze engagement metrics across platforms and get recommendations for content strategy without manually comparing spreadsheets.
Pitfalls to Watch Out For
Even with AI tools, there are some common mistakes to avoid:
- Garbage in, garbage out. AI analysis is only as good as your data. Make sure your columns are labeled clearly and your dates are consistent before uploading.
- Over-relying on the AI's interpretation. Always check the underlying numbers, especially for decisions that matter. AI tools are great at patterns but not infallible.
- Not asking the right questions. The tool can only answer what you ask. Spend time thinking about what you want to know before you start.
- Ignoring the context. A number might look great or terrible depending on the broader picture. Ask follow-up questions to get more context.
Building a Routine Around AI Data Analysis
The best results come from making AI data analysis a regular part of your workflow, not just a tool you use occasionally. Set aside time each week to explore your data, ask new questions, and track how your insights change over time. Share your findings with your team so everyone benefits from the insights you uncover.
Start small with a single dataset and one tool. Once you are comfortable, expand to other data sources and try more advanced features. The goal is not to become an expert analyst but to make better decisions faster, and AI data analysis tools are now good enough to make that genuinely achievable for anyone.